SVG vs Canvas in Practice
Written by Enoch Tsang on April 25th, 2017
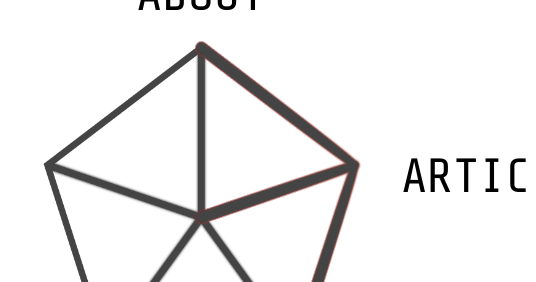
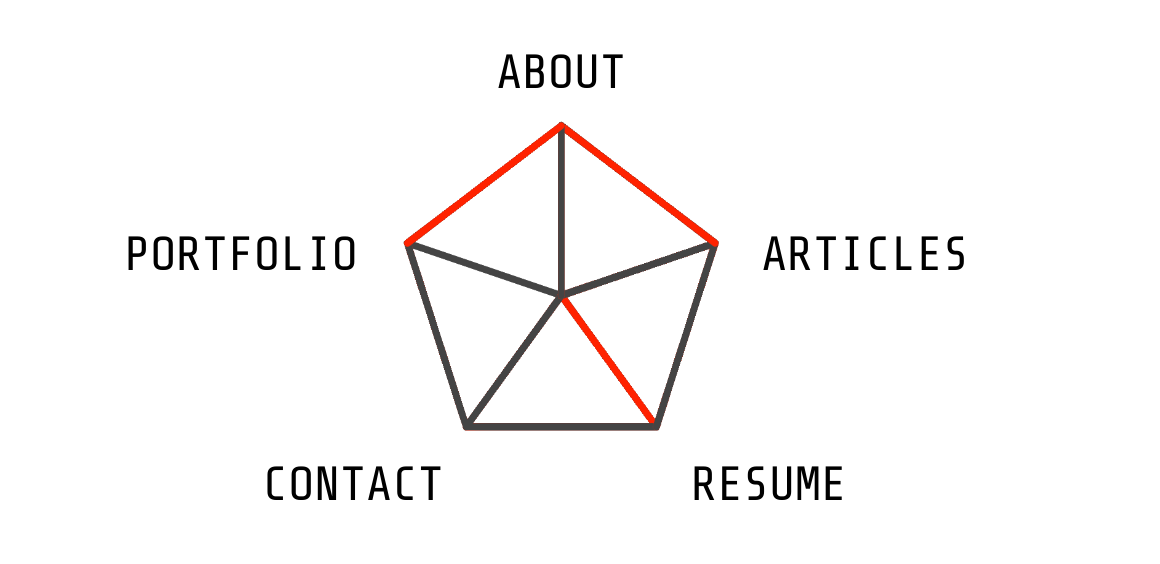
The pentagon animation in the navigation bar was originally created using the html <canvas> tag.
Although using a canvas wasn’t particularly difficult, there were a few pain points:
Mostly due to the first issue, I decided to switch to using SVG graphics. SVG stands for scalable vector graphics, it’s an image format but defined in a text format compared to a binary one like JPEG. You can read more about the benefits of using SVG in the conclusion. To my pleasant suprise, switching to using SVG graphics resulted in fixing all the other pain points as well.
If you’re looking for an explanation of the SVG code or just some example code, you can skip down to the implementation section. If you’re looking for a summary of using SVG vs canvas, you can skip down to the conclusion section. Otherwise you can keep reading on to see how SVG fixed all the pain points I described!
Pain points
The lack of anti-aliasing
If you don’t know, anti-aliasing is basically edge smoothing.
This is very common practice in graphics work.
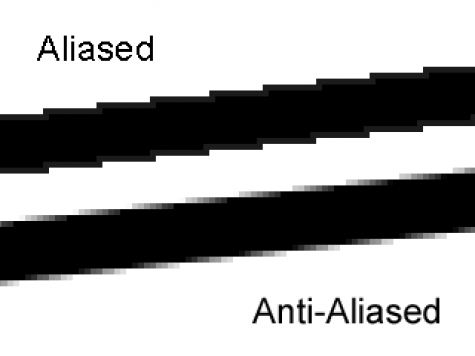
This was a problem on the canvas version of the pentagon, the jagged edges were very noticeable at 1080p and below.

SVG fixes this problem because an SVG file doesn’t define an image by pixel locations, but instead as a set of instructions.
This let’s a browser (or any application) decide how to render a <line> or a <path>.
You can see this first hand by zooming in on the pentagon versus zooming in on any of the images in this article.
You should see more and more pixels as you zoom into the images.
But with the SVG graphic of the pentagon, the quality doesn’t deteoriate as you zoom in; hence the S in SVG, scalable.
JavaScript requirement for static elements
In general, I’ve found that it’s a good idea to keep client side scripting limited to dynamic elements. Any static elements are better done in the HTML. Using a canvas broke this methodology because everything drawn in a canvas must be done via scripting.
This was the HTML code in the canvas implementation.
<canvas class="pentagon" width="520" height="495"></canvas>
The rest of it was defined in JavaScript. This was a problem because the HTML no longer gave a clear representation of what the page looked like. This meant that dynamic as well as static elements were then mixed together in the JavaScript.
On the contrary, once I switched to SVG, this was the resulting HTML code.
<svg class="pentagon" viewbox="0 0 520 495">
    <!-- Perimeter -->
    <!-- [260.0, 10.0]  top -->
    <!-- [10.0, 191.5]  topleft -->
    <!-- [105.5, 475.5] botleft -->
    <!-- [414.5, 475.5] botright -->
    <!-- [510.0, 191.5] topright -->
    <path d="M260.0,10.0 L10.0,191.5 L105.5,475.5 L414.5,475.5 L510.0,191.5 L260.0,10.0 Z"/>
    <!-- Inner lines -->
        <!-- center -->
        <!-- [260.0, 272.5] -->
    <line x1="260.0" y1="10.0" x2="260.0" y2="272.5" />
    <line x1="10.0" y1="191.5" x2="260.0" y2="272.5" />
    <line x1="105.5" y1="475.5" x2="260.0" y2="272.5" />
    <line x1="414.5" y1="475.5" x2="260.0" y2="272.5" />
    <line x1="510.0" y1="191.5" x2="260.0" y2="272.5" />
</svg>
The HTML now gave a clear representation of what the page looked like. Not only that, dynamic and static concerns were now separated.
Inability to interact with already drawn elements
Ultimately the effect I was thinking of with the pentagon was energy coming towards the cursor and then disappating when the cursor left. So ideally, to keep the thought process the same as how it’s represented in the code, the red lines would be an object created on hover and be destroyed off hover.
This isn’t possible on a canvas, because after drawing, it’s like painting, it can’t be taken off or edited after the fact.
My solution at the time was to redraw a black line over the newly drawn red line, which worked, but was a little finicky.
I had attempted to add box-shadowing to the lines earlier on to fix the anti-aliasing problem, but then the black lines would not cleanly draw over the red lines.
You can see a tinge of red left over after redrawing the black lines.
Using SVG elements, the red lines can be drawn, undrawn, and removed, all as it’s own object.
This follows much more fluently with the original thought process and also gives security that the red line will actually be gone, not just covered up.
Strange timing related behaviour
Due to the nature of pixels being drawn and not elements being edited, using a canvas came with some timing oddities.
The first being some lines being left over during various interactions.
While that was resolved using SVG elements, it also gave a much crisper effect.
With the canvas, the lines would end up being erratic when continouously switching them on and off.
With the SVG elements it became smoother.
Implementation
There were two steps in implementing the pentagon graphic.
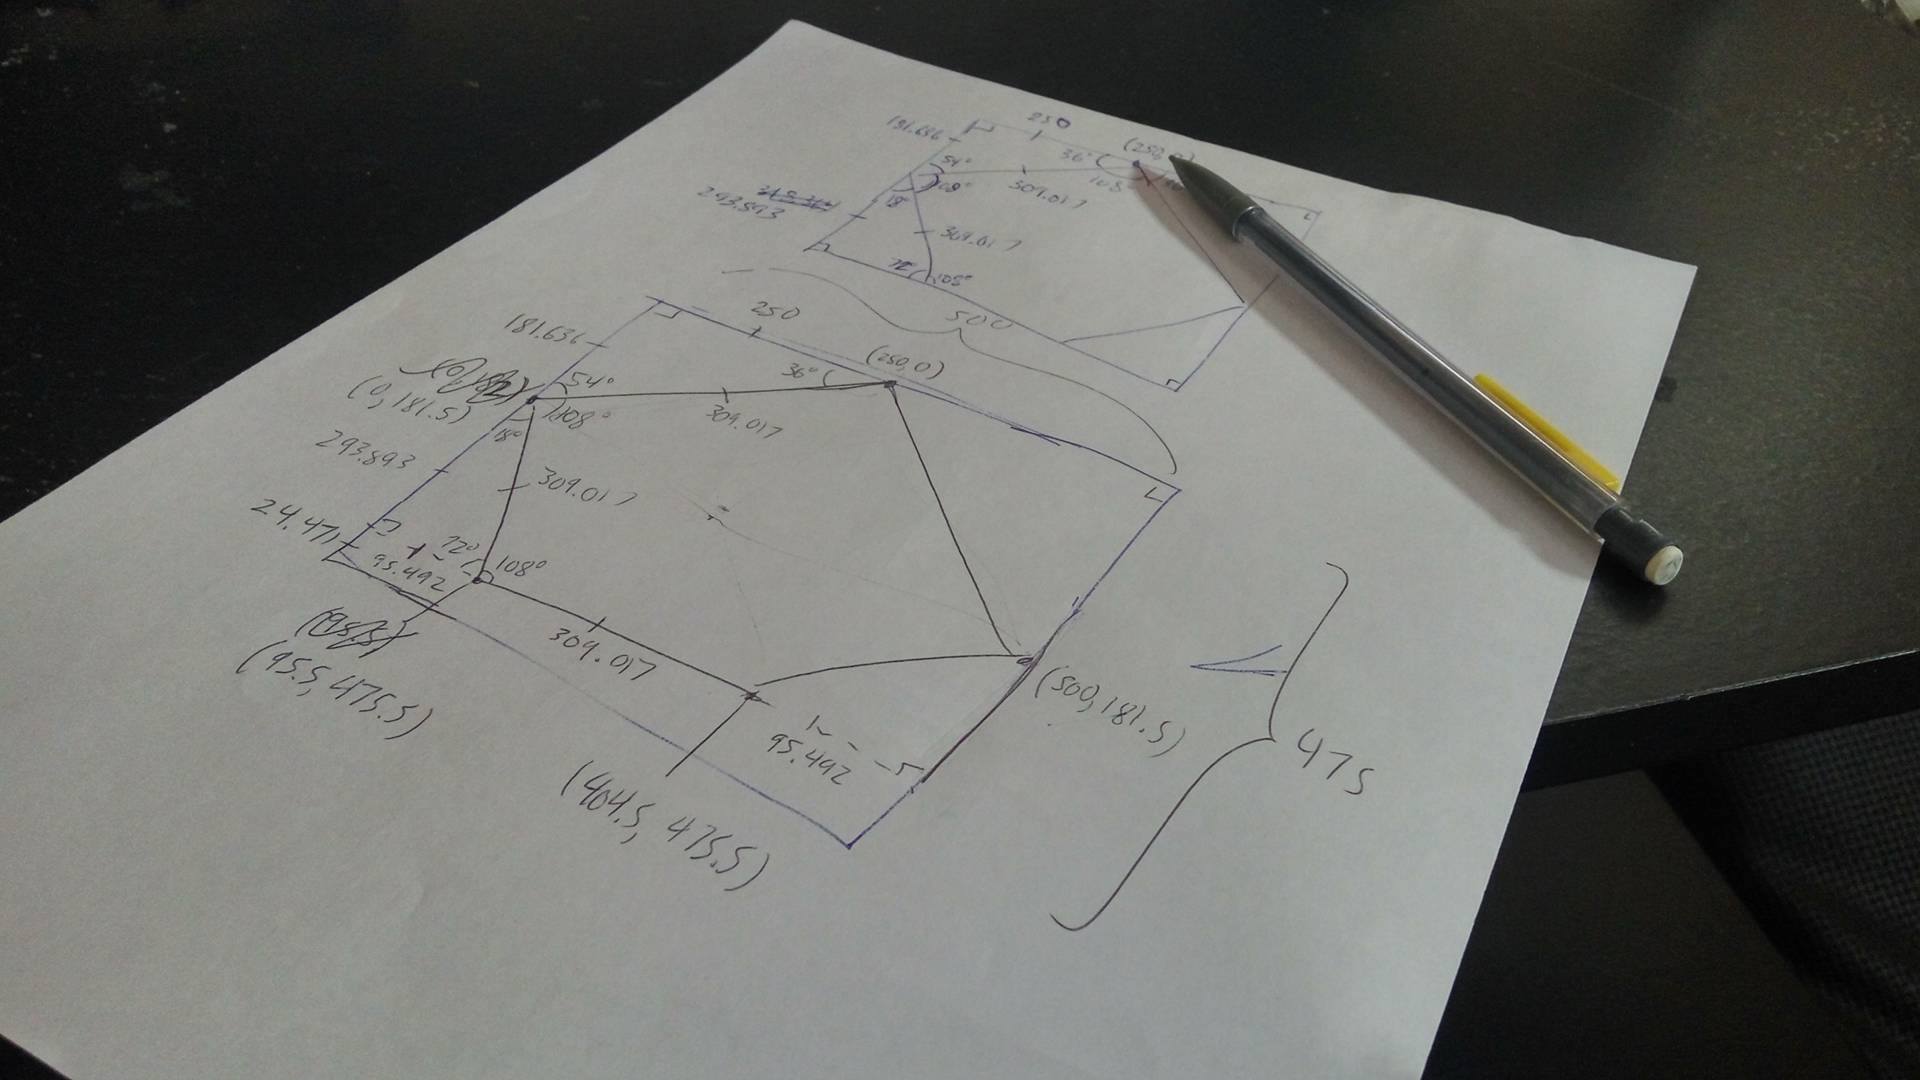
I also had to pre-calculate all the points, but that was just some trigonometry.
Drawing the Pentagon
Minus the comments, here is the static HTML code for the entirety of the navigation icon.
<div class="navigation-icon">
    <div class="navigation-links">
        <h2 class="about"><a>about</a></h2> <!-- top -->
        <h2 class="portfolio"><a>portfolio</a></h2> <!-- topleft -->
        <h2 class="contact"><a>contact</a></h2> <!-- botleft -->
        <h2 class="resume"><a>resume</a></h2> <!-- botright -->
        <h2 class="articles"><a>articles</a></h2> <!-- topright -->
    </div>
    <svg class="pentagon" viewbox="0 0 520 495">
        <path d="M260.0,10.0 L10.0,191.5 L105.5,475.5 L414.5,475.5 L510.0,191.5 L260.0,10.0 Z"/>
        <line x1="260.0" y1="10.0" x2="260.0" y2="272.5" />
        <line x1="10.0" y1="191.5" x2="260.0" y2="272.5" />
        <line x1="105.5" y1="475.5" x2="260.0" y2="272.5" />
        <line x1="414.5" y1="475.5" x2="260.0" y2="272.5" />
        <line x1="510.0" y1="191.5" x2="260.0" y2="272.5" />
    </svg>
</div>
The CSS code to position the navigation links was just alot of guess and check work with absolute positioning. You can get an idea of what that looks like with some of the CSS code.
...

.about {
    top: -2.6rem;
}

.portfolio {
    top: 3.1rem;
    right: 10rem;
}

.contact {
    bottom: -2.6rem;
    right: 6.5rem;
}

...
The entirety of it is publicly available on my GitHub.
But that’s not the interesting part, let’s break down the <svg> element.
viewbox
<svg class="pentagon" viewbox="0 0 520 495">
The viewbox attribute defines the space that you’ll be working with, this is different from the width and height.
You can set the viewbox to be any size, then resize it later using the width and height properties in CSS.
The first two numbers 0 0 define the starting x and y coordinates of the space.
The second two numbers 520 495 define the length and height of the space, in other words, defining how far you can draw before leaving the <svg> element.
path
<path d="M260.0,10.0 L10.0,191.5 L105.5,475.5 L414.5,475.5 L510.0,191.5 L260.0,10.0 Z"/>
The <path> element is defined by it’s d attribute, which is a set of instructions for a path to follow.
The first instruction M260.0,10.0 means Move to the coordinates (260.0, 10.0).
The subsequent L instructions mean Lineto the coordinate location.
And finally the Z instruction means to close the path.
line
<line x1="260.0" y1="10.0" x2="260.0" y2="272.5" />
The <line> element is fairly self explanatory, it just draws a line from (x1, y1) to (x2, y2).
CSS
Lastly, setting the width and color of the lines require unique CSS properties.
.pentagon path, .pentagon line {
    stroke-width: 11;
    stroke: #444;
    fill: none;
}
stroke-width defines the thickness of the paths and lines.
stroke defines the color of the path and lines.
fill sets what color to fill an enclosed <path> with.
Animating the Pentagon
Animating the pentagon was done using the velocity.js and jquery.js libraries.
Let’s start by creating a new <line> element.
The most logical approach would be to use the standard approach in jQuery, but it turns out that creating SVG elements require a namespace.
Here is the correct code to create a new SVG element.
var newLine = document.createElementNS('http://www.w3.org/2000/svg','line');
Next, we’ll set the attributes so it is a non existent line that starts from the center of the pentagon.
We’ll also give it a penta-red class which will make these animated lines red.
The penta-red class is custom defined in the CSS.
newLine.setAttribute("class", "penta-red");
newLine.setAttribute("x1", 260.0);
newLine.setAttribute("y1", 272.5);
newLine.setAttribute("x2", 260.0);
newLine.setAttribute("y2", 272.5);
And add the line to the <svg> element.
$(".pentagon").append(newLine);
Now we can use the velocity.js library to animate drawing the line.
$(newLine).velocity({
    x2: 260.0,
    y2: 10.0
}, 500);
This creates an animation over 500ms to extend the line from the previous set x1 and y1 to the new x2 and y2.
Putting it all together, and encapsulating into an on hover callback, we get:
$(".about a").hover(function() {
    var newLine = document.createElementNS('http://www.w3.org/2000/svg','line');
    newLine.setAttribute("class", "penta-red");
    newLine.setAttribute("x1", 260.0);
    newLine.setAttribute("y1", 272.5);
    newLine.setAttribute("x2", 260.0);
    newLine.setAttribute("y2", 272.5);
    $(".pentagon").append(newLine);

    $(newLine).velocity({
        x2: 260.0,
        y2: 10.0
    }, 500);
});
Now we need to undraw the line when off hover. That’s easy, just animate the start point into the end point.
$(".penta-red").velocity({
    x1: 260.0,
    y1: 10.0
}, 500);
But there’s a problem with this. By default, velocity will queue up animations, so the line won’t undraw itself until the previous animation of drawing itself is finished.
To fix this, we just override that default option by setting queue to false.
$(this).velocity({
    x1: 260.0,
    y1: 10.0
}, {
    duration: lineAnimTime,
    queue: false
});
The last piece of the puzzle is removing the line when the animation finishes.
This can be done with the complete option.
$(this).velocity({
    x1: 260.0,
    y1: 10.0
}, {
    duration: lineAnimTime,
    queue: false
    complete: function() {
        $(this).remove();
    }
});
Putting it altogether into the off hover callback it looks like.
$(".about a").hover(function() {
    var newLine = document.createElementNS('http://www.w3.org/2000/svg','line');
    newLine.setAttribute("class", "penta-red");
    newLine.setAttribute("x1", 260.0);
    newLine.setAttribute("y1", 272.5);
    newLine.setAttribute("x2", 260.0);
    newLine.setAttribute("y2", 272.5);
    $(".pentagon").append(newLine);

    $(newLine).velocity({
        x2: 260.0,
        y2: 10.0
    }, 500);
}, function() {
    $(this).velocity({
        x1: 260.0,
        y1: 10.0
    }, {
        duration: lineAnimTime,
        queue: false
        complete: function() {
            $(this).remove();
        }
    });
});
Functionally, this is what it takes to draw a line on hover, and undraw off hover. In the actual code, there’s more parametrization to draw multiple lines for varying links, you can read the entirety of it on my GitHub.
Conclusion and Lessons Learned
SVG graphics are very easy to define as an HTML element, and from a development perspective, they are easy to manipulate. Canvases on the other hand are fast and have a lot of freedom, down to editing pixel by pixel, but they lack the ease of manipulation as a dynamic element.
In the future, SVG will most likely be the solution for uniquely dynamic elements in a web page. They are easy to manipulate since SVG graphics are composed of many smaller elements, all of which can be individually managed. SVG graphics are also much more scalable and delegate the responsibility of drawing smooth images to the browser. Also since SVG is defined in XML, it can be directly embedded in HTML, keeping static and dynamic concerns separate.
The use case for canvas is not dynamic icons in a web page, but rather complex pixel level problems. In the future I hope to employ SVG graphics in more of my work and have the experience of creating complicated exceptional graphics using SVG.